Table of Contents
About Me

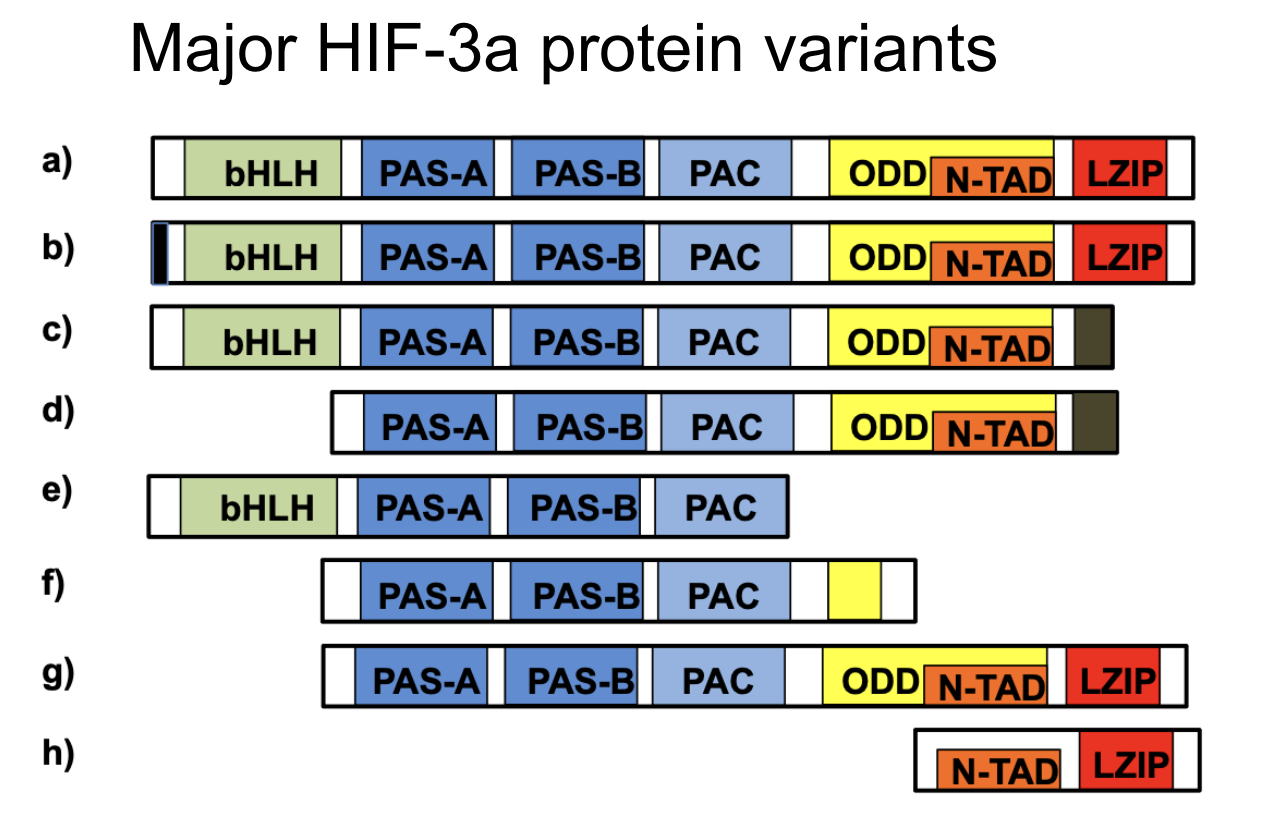
Hello my name is John! I am currently a 4th year CS (with a Specialization in Bioinformatics) student. To harness my programming skills, I currently volunteer as a bioinformatics undergraduate researcher at Moores Cancer Center at UC San Diego Health in Dr. Hojun Li’s lab where I use various bioinformatics tools via R and Python. My work mainly focuses on analyzing gene expression using RNA-seq data. My main goal in lab is to determine which Hif3-A gene isoform induces cell differentiation of BFUE to CFUE through analysis of alternative splicing.

Outside of school, I LOVE to play and watch tennis. I also have a 3 year old dog named June. He is a German Shepherd and Belgian Malinois mix. We both love to go on hikes especially on cooler days. Other hobbies I have are:
- Listening to true-crime podcast
- Taking joy rides with my dog around San Diego
Programming Experience
My programming experience comes primarily from my coursework at UCSD and my research work in bioinformatics. I have experience with using the following programming languages (ordered by favorability):
- Python
- bash
- R
- C++
- C
- Java
Most recently, I have been tasked by my lab PI to perform analysis on the Socs1 gene (with respect to the addition of Dexamethasone). With this work, I have been employing Python libraries such as Numpy and Pandas. As part of the analysis, I am also tasked to visualize my results and as such, I have been using visualization libraries such as seabourne and matplotlib in my project. This is my favorite part of every project I work on. It is very satisfying to watch the data with pretty colors!
Below is a snippet of the code I used to visualize gene expression data:
import seaborn as sns
import matplotlib.pyplot as plt

celltypes = ["Erythroid1", "Erythroid3", "Erythroid4", "Erythroid5"]

for ct in celltypes:

    df_ct = violin_df[violin_df["CellType"] == ct]

    plt.figure(figsize=(6,5))

    sns.violinplot(
        data=df_ct,
        x="CellType",
        hue="day",
        y="Socs1",
        inner="box",
        order=["CTRL","D1","D3","D7"],
        density_norm='width'
    )

    sns.stripplot(
        data=df_ct,
        x="day",
        y="Socs1",
        color="black",
        size=3,
        jitter=True,
    )

    plt.title(f"Socs1 Expression — {ct}")
    plt.ylim(None, None)
    plt.show()
Here is one of the violin plots that this code produces.
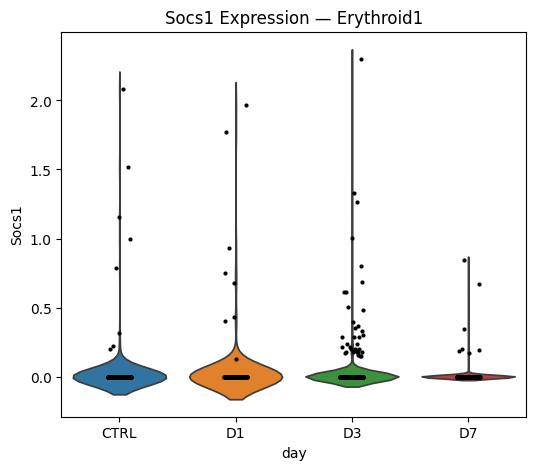
Goals
As a programmer/bioinformatician in this crazy AI world, I always strive to be better everyday. Here are some of my short term goals
- Continue to read in pandas and numpy
- Do 3-4 leetcode challenges every week
- Read 1 paper about bioinformatics tools every week
- Learn and start reading into Machine Learning
Perpetual long term goal:
- Learn something new everyday
In the Goals section, I made a point to separate my long term goal because as my all time GOAT said:
Luck has nothing to do with it because I have spent many, many hours, countless hours, on the court working for my one moment in time - Serena Williams
I try to live by this mindset especially in coding. Growth doesn’t happen overnight, it’s built one small step at a time. If I can learn even a little something new every day, then I know I’m moving forward, becoming better than I was yesterday, and getting one step closer to where I want to be!